How to show network speed in your Mac's menu bar
You want a live upload and download number sitting next to the clock — not a window you have to open. macOS doesn't do that on its own, but it takes about a minute to add. Here's the built-in option and the free one-click way — working on macOS Sonoma and Sequoia, Apple Silicon and Intel.
Does macOS show network speed in the menu bar?
Short answer: no, not by itself. macOS can show network activity two ways out of the box — the Network tab in Activity Monitor, and a tiny live graph on Activity Monitor's Dock icon (View → Dock Icon → Show Network Usage). Neither puts a readable upload/download number in the menu bar, and both mean keeping Activity Monitor running and glancing at the Dock.
To get the actual speed in the menu bar, where you can see it at a glance over any app, you add a small menu bar app. The lightest free option is LiveMetrics.
The quick way: LiveMetrics (free, ~1 minute)
- Download LiveMetrics — it's a free ~1.4 MB disk image (.dmg). Download for macOS.
- Drag LiveMetrics to your Applications folder from the opened disk image.
- Open LiveMetrics. It's notarized by Apple, so it opens with a normal double-click — if macOS asks to confirm the download, click Open. (See first-launch notes below.)
- That's it — live upload and download speed now appear in your menu bar, updated every second.
- Optional: open the menu and turn on Launch at Login so it's always there when you start your Mac.
Download LiveMetrics — Free macOS 14 Sonoma or later · Apple Silicon & Intel · no account, no tracking
Using the built-in Activity Monitor instead
If you'd rather not install anything, the free built-in route is:
- Open Activity Monitor (Applications → Utilities, or Spotlight).
- Click the Network tab to see data sent/received and packets per second.
- Optionally choose View → Dock Icon → Show Network Usage for a small live graph on the Dock.
It works, but it's a separate app and a separate window or Dock glance — there's no clean number in the menu bar, no today's-peak, and the Network tab is more about totals than a live at-a-glance reading. That gap is exactly what a menu bar monitor fills.
What's a "good" reading — and why is my internet slow?
A live monitor answers the slow-internet question instantly. If your download number sits near its usual ceiling while a page or file crawls, the connection is working hard and the bottleneck is elsewhere (the server, your Mac, an app). If it's barely moving while you wait, the network itself is the suspect. The rolling graph also surfaces dropouts and dips that a one-off speed test would miss entirely.
Note this is a passive monitor, not a speed test: it shows the real traffic already flowing through your Mac, second by second, rather than generating traffic to a server to measure a maximum. The two answer different questions — use a speed test for a max-throughput figure, and a monitor to see what your connection is doing right now.
Reading the numbers: bytes vs bits (MB/s vs Mbps)
Menu-bar speed tools report bytes per second (MB/s), while internet plans are sold in bits per second (Mbps) — they are not the same number. Since 1 byte = 8 bits, you divide a bit-rate by 8 to get the byte-rate. So a 200 Mbps plan tops out near 25 MB/s of actual transfer.
| Plan speed (Mbps) | Real transfer (MB/s) |
|---|---|
| 100 Mbps | 12.5 MB/s |
| 200 Mbps | 25 MB/s |
| 500 Mbps | 62.5 MB/s |
| 1 Gbps | 125 MB/s |
LiveMetrics lets you switch between bytes (KB/s, MB/s) and bits (Kb/s, Mb/s), so you can read the menu bar in whichever unit your plan uses.
First launch: what to expect
LiveMetrics is signed and notarized by Apple (Developer ID: palmy llc), so it opens with a normal double-click. The first time you open it, macOS may ask "LiveMetrics is an app downloaded from the Internet. Are you sure you want to open it?" — click Open and you're done. No System Settings trip, no right-click → Open, no Terminal command, and no Apple ID. Notarization is checked offline, so it works even without a network connection.
If macOS ever blocks an app outright with "Apple could not verify LiveMetrics is free of malware…" or "unidentified developer," that points to a damaged or incomplete download — re-download the .dmg from net.mdrashid.com and open it again. After the first launch, LiveMetrics keeps itself updated automatically.
Also show CPU, GPU, RAM, temperature, power & fans in the menu bar
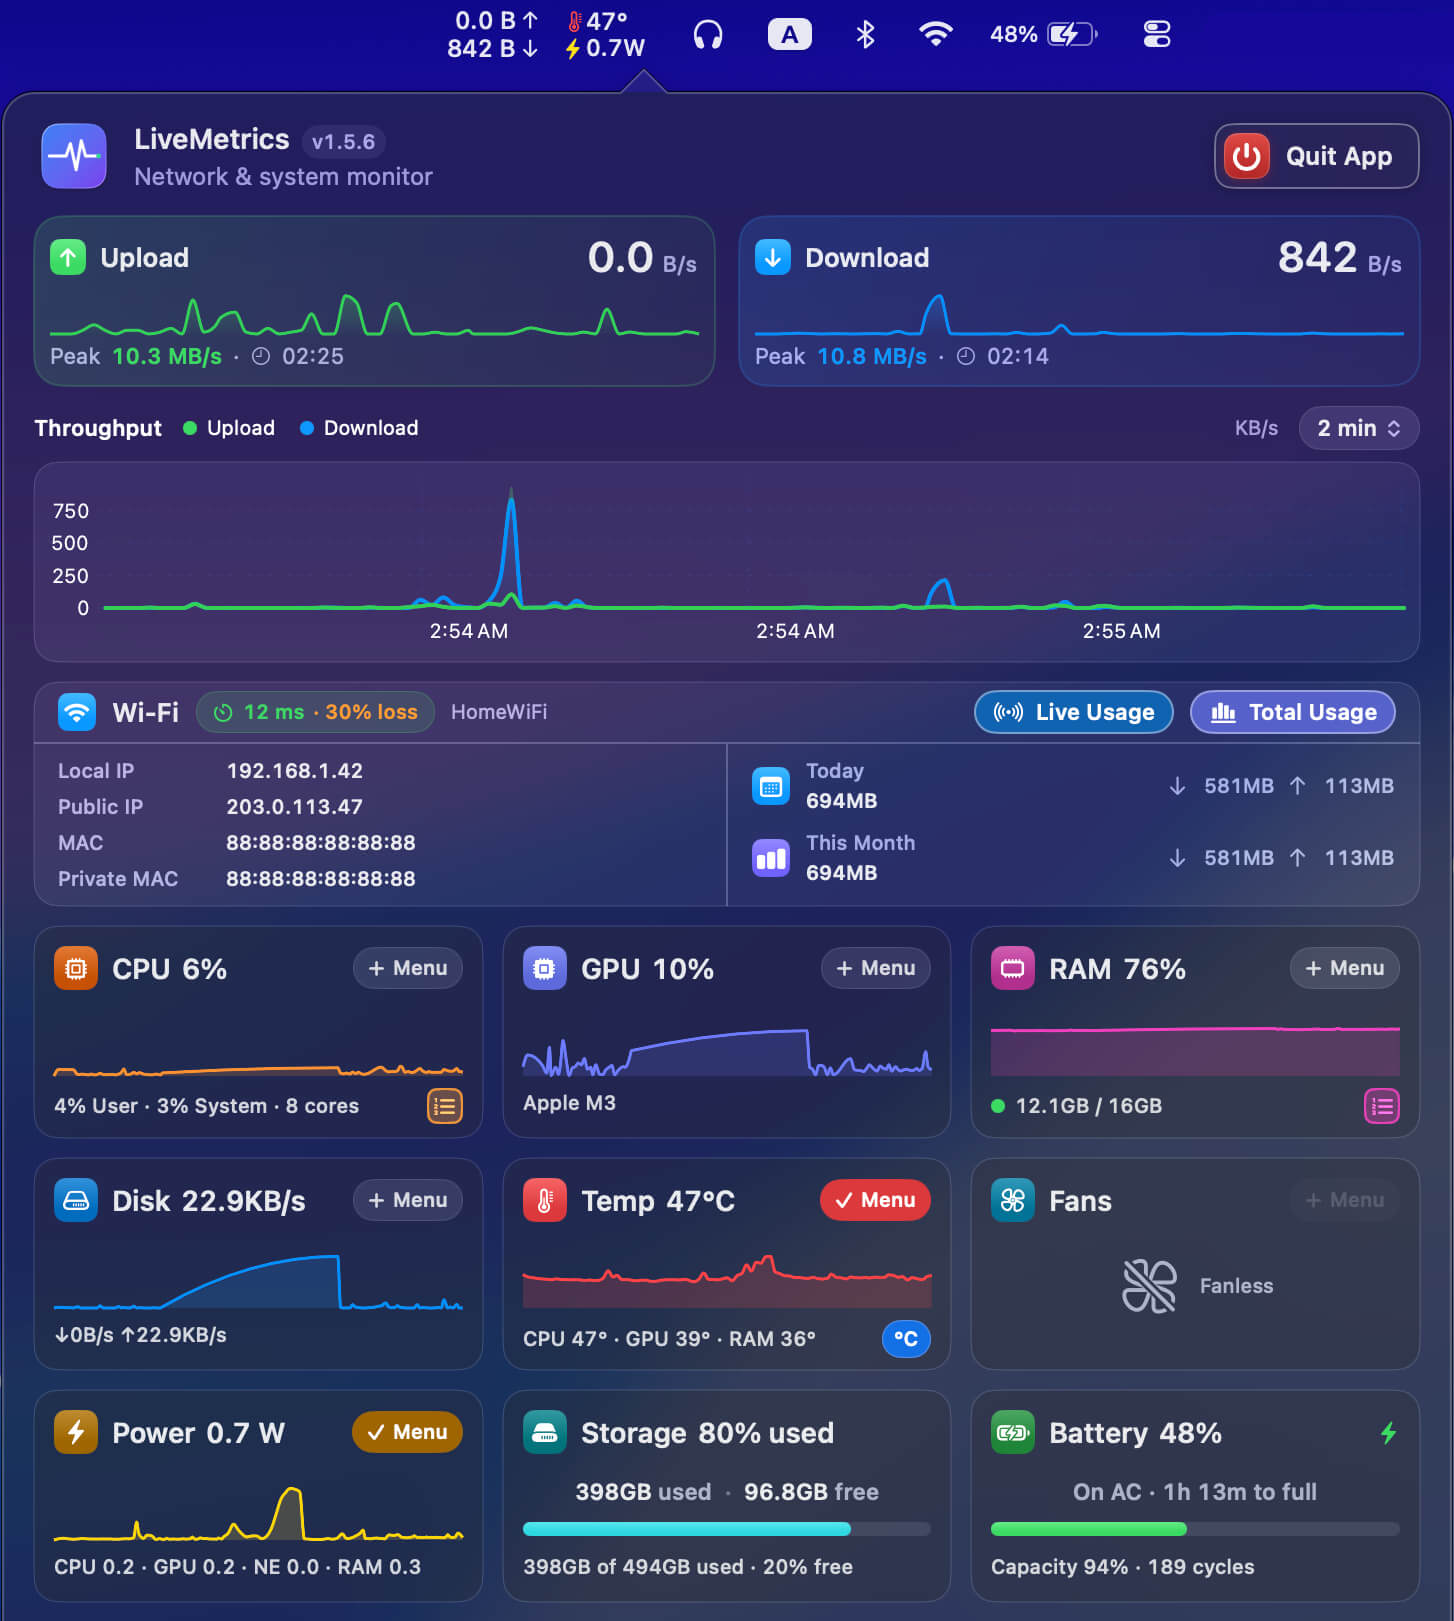
LiveMetrics is a full network + system monitor out of the box. Out of the box it shows network speed plus temperature and power draw right in the menu bar — and every chip is customizable, so you can turn either off or swap in CPU, GPU, RAM, disk and fans. The available metrics are:
- Temperature — CPU, GPU and RAM sensors read straight from Apple's SMC, in °C or °F. Pinned by default.
- Power draw — live wattage, root-free. On Apple Silicon it reads per-domain SoC power (CPU, GPU, Neural Engine, RAM) and whole-machine draw on battery; it degrades gracefully on Intel and desktops without the sensors. Pinned by default.
- CPU load — overall processor usage. Pinnable chip, one tap away.
- GPU utilization — graphics activity. Pinnable chip, one tap away.
- RAM — used %, memory pressure, and swap. Pinnable chip, one tap away.
- Disk — read/write throughput. Pinnable chip, one tap away.
- Fan speeds — RPM, or "Fanless" on Macs without fans. Pinnable chip, one tap away.
- Storage — disk space used and free, with a capacity bar. Read-only popover card, not pinnable.
- Battery — on laptops: charge %, charging state, time remaining or to full, plus battery health % and cycle count. Read-only popover card, not pinnable; hidden on desktop Macs.
Each pinnable metric gets its own popover card with a rolling 5-minute sparkline. The defaults (temperature and power draw) show as colored chips next to your speed numbers, and you can pin up to six system metrics at once — up to four pinned chips pack 2-per-row, and a fifth or sixth chip packs 3-per-row so the item grows wider, never more than two rows tall. The popover also adds read-only Storage (disk space used and free on a capacity bar) and, on laptops, Battery (charge, time remaining, health % and cycle count) cards that never appear as menu-bar chips. To customize the chips: open the LiveMetrics panel → the "System" section → tap the "Menu bar" pill on a metric card to turn one off or swap in CPU, GPU, RAM, disk or fans. You can pin up to 6 system metrics at once. It stays zero-dependency and sends nothing anywhere.
Check your Mac's download speed without running a speed test
A speed test gives you one number — the maximum your connection can deliver when nothing else is competing for it. A passive bandwidth monitor like LiveMetrics gives you the opposite: the actual throughput your Mac is using right now, continuously, across every app and background process. They answer different questions.
If you want to know whether your 500 Mbps plan is being delivered, run a speed test. If you want to know whether a Zoom call is choking your download, or whether a background backup is why your Mac feels slow, watch the LiveMetrics menu bar readout. The rolling graph makes dropouts and sustained bursts visible in a way a one-off test cannot — and you can widen it up to 30 minutes.
On Wi-Fi specifically, LiveMetrics follows whichever interface is active, so switching from Ethernet to Wi-Fi mid-session keeps the readout going with no setting change. The numbers reflect true Wi-Fi throughput delivered to your Mac, not the link speed your router advertises.
Want a full system monitor comparison?
If you want to weigh LiveMetrics's system metrics against a dedicated tool, see the free iStat Menus alternatives compared to decide between LiveMetrics, iStat Menus, Stats, and Activity Monitor, or read the LiveMetrics vs Stats comparison. You can also add a free live watts / power monitor to the menu bar — or browse all of LiveMetrics's features.
FAQ
Does macOS show network speed in the menu bar by default?
No. macOS shows network activity in Activity Monitor's Network tab and can show a small graph on its Dock icon, but it has no built-in way to put a live upload/download speed number in the menu bar. A lightweight app like LiveMetrics adds it.
Is there a free way to see internet speed in the Mac menu bar?
Yes. LiveMetrics is a free macOS app that puts live upload and download speed in your menu bar. Download the .dmg, drag LiveMetrics to Applications, and open it. The speed then appears next to the clock.
Will a menu bar speed monitor slow down my Mac?
No. LiveMetrics only reads the network byte counters macOS already maintains (via getifaddrs()), so it uses very little CPU and has no Dock icon or extra windows.
Can LiveMetrics also show CPU, RAM or temperature?
Yes — it does out of the box. Alongside live network speed, LiveMetrics shows temperature (CPU/GPU/RAM, °C/°F via Apple's SMC) and power draw in watts in the menu bar by default, so it's a full network + system monitor the moment you open it. CPU load, GPU utilization, RAM (used %, pressure, swap), disk read/write, and fan speeds are one tap away. The popover also adds read-only Storage (disk space used and free) and, on laptops, Battery (charge, health % and cycle count) cards. Every chip is customizable — open the LiveMetrics panel, go to the "System" section, and tap the "Menu bar" pill on a metric to turn it off or swap in another. You can pin up to 6 system metrics at once, shown as colored chips next to your speed numbers.
Does this work for Wi-Fi and Ethernet at the same time?
Yes. LiveMetrics reads from all active network interfaces at once, so if you use Wi-Fi and Ethernet together (common on desktop Macs with a hub) it shows combined throughput. It also follows whichever interface is active, so switching connections never zeroes the readout.
Can I see network speed in the menu bar on macOS Sequoia?
Yes. LiveMetrics runs on macOS 14 Sonoma and later, which includes macOS 15 Sequoia. It is notarized by Apple, so it opens with a normal double-click — no Privacy & Security approval needed.
Does LiveMetrics show which app is using my bandwidth?
No — LiveMetrics shows total interface throughput, not a per-app breakdown. For per-process network usage, open Activity Monitor (Applications > Utilities), click the Network tab, and sort by Bytes Sent or Bytes Rcvd. LiveMetrics is the always-on glanceable monitor; Activity Monitor is the per-process diagnostic.
How do I show download and upload speed in the macOS menu bar?
Download a free menu-bar app such as LiveMetrics (~1.4 MB, notarized). Once running, it shows live download and upload speed in the menu bar, refreshing every second. It passively reads local network stats, tracks today's peak, and needs no accounts, sudo, or kernel extensions.