Live in the menu bar
Watch upload and download speed update every second, without opening a thing.
LiveMetrics is a free macOS menu bar app showing live upload and download speed every second, read from your Mac's own interface counters — so the numbers reflect what's actually moving. Speed, temperature and power draw are shown by default — CPU, GPU, RAM and more are one click away, a full system monitor whenever you want it, every metric yours to swap or turn off.

Live per-app bandwidth, total data used, and the top apps by CPU or RAM — each a single click away, with force-quit right from the list.
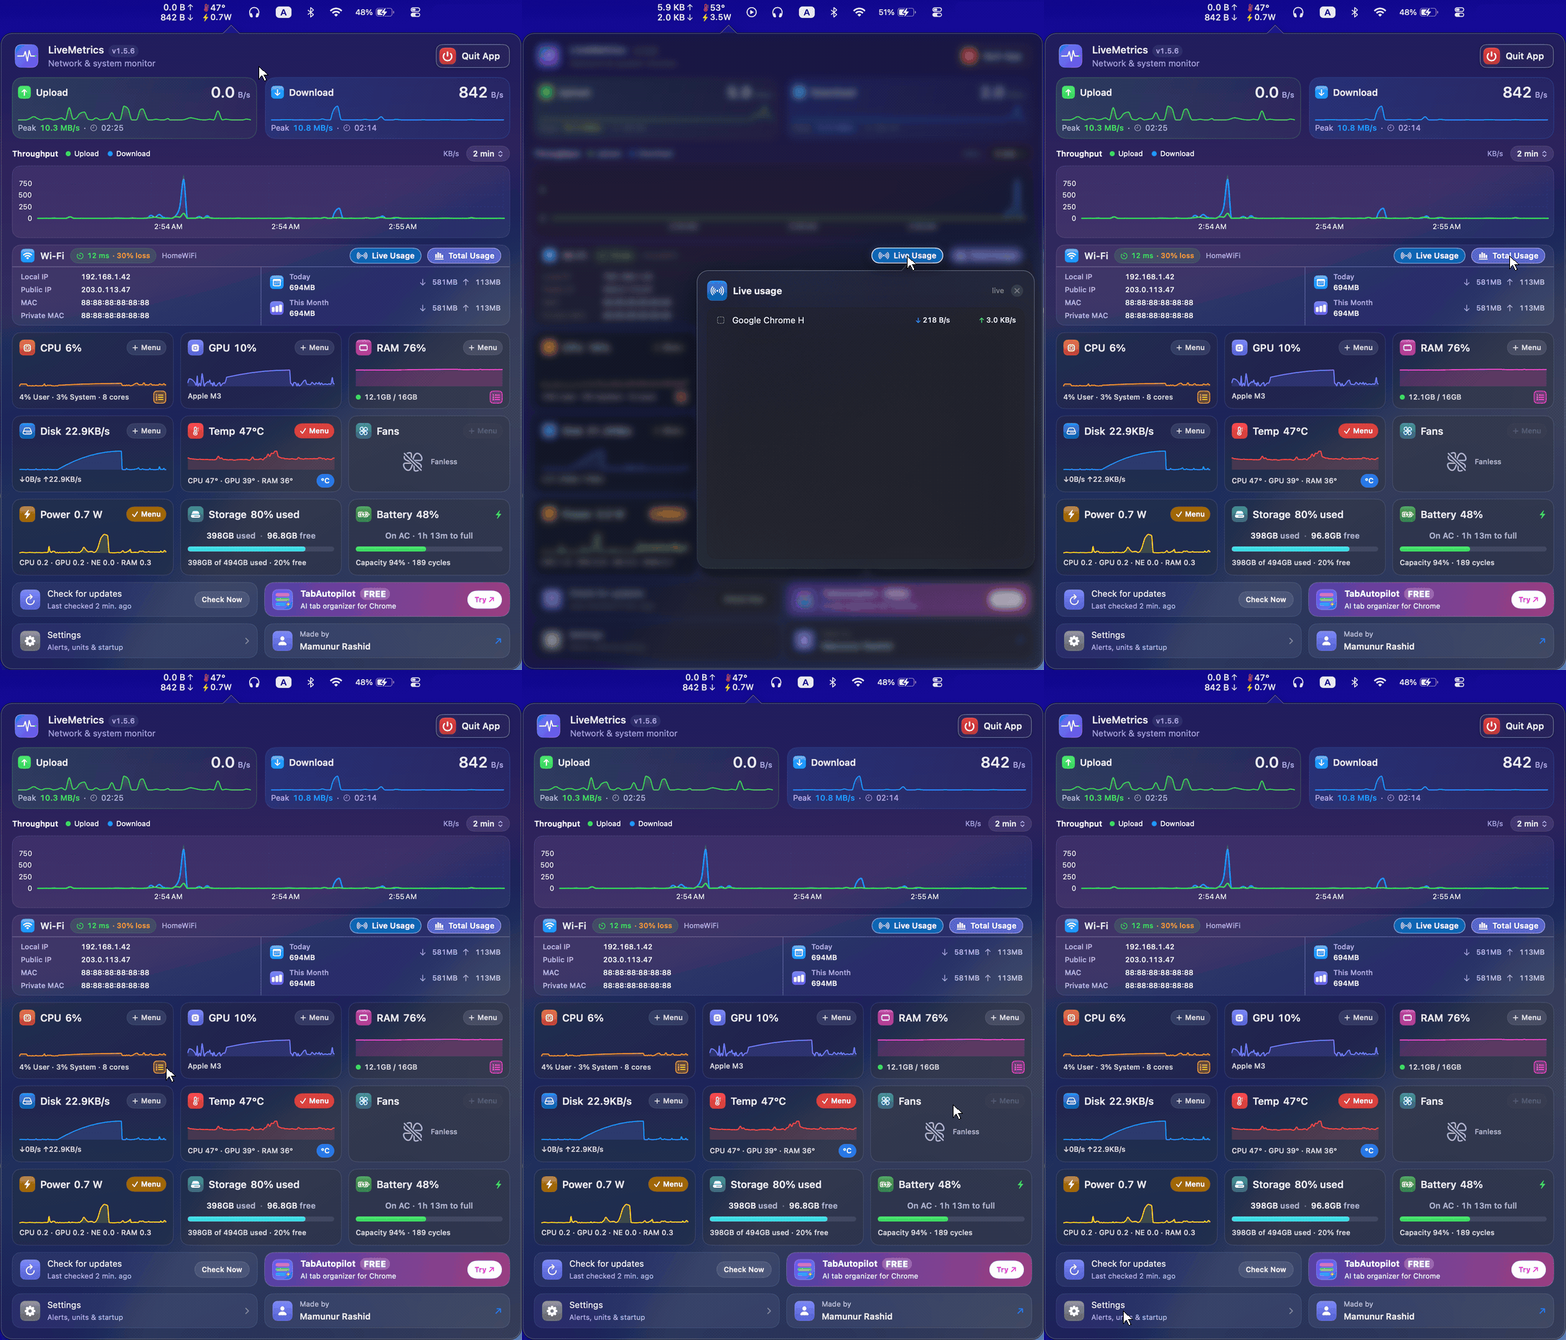
Everything you need to read your connection — and your Mac's vitals — at a glance. Network speed, temperature and power draw show by default; CPU, GPU, RAM, disk and fans are a tap away.
Watch upload and download speed update every second, without opening a thing.
LiveMetrics tracks your highest upload and download throughput for the day.
A Swift Charts graph of recent network activity — pick a window from 1 minute up to 30 (5 by default).
It measures real traffic passively — no servers pinged, nothing to run.
Reads only local interface stats. No accounts, no tracking, nothing sent anywhere.
A lightweight network monitor built in pure Swift — it reads counters and sips CPU, with no Dock icon and no clutter.
Not just how fast — but which apps, how healthy the link is, and how much you've used.
Wi-Fi network name, local and public IP, your factory and private (randomized) MAC address, and whether you're on Wi-Fi, Ethernet, VPN, or offline.
A rolling ping in milliseconds plus packet-loss tracking, so you can tell a slow link from a flaky one.
See which apps are talking right now — live top talkers with up/down per second — plus a cumulative list of the biggest data consumers.
Today's and this month's up/down totals, with automatic rollover at midnight and each new month — handy on a metered or capped plan.
Optional macOS notifications when CPU, RAM, or temperature stay high, or free disk space runs low — with cooldowns so they never spam you.
Flip every temperature reading between Celsius and Fahrenheit with a single tap.
Out of the box, temperature and power draw ride in the menu bar next to your network speed — each a live card with a 5-minute sparkline, up to six system chips at once. Add CPU load, GPU usage, RAM, disk activity or fans, or turn any off; metrics you switch off do no work.
Overall and per-core percentage, the user/system split, and your core count — read straight from the kernel.
Vendor-agnostic utilization across Intel, AMD and Apple Silicon, with the GPU name (like "Apple M3").
Used percentage, used vs total, macOS memory pressure (green/yellow/red), plus compressed and swap.
Live read and write throughput as your Mac reads from and writes to disk.
Disk space used and free, with a capacity bar so you can see how much room is left at a glance.
CPU, GPU and RAM sensors in °C or °F, read directly from the Apple SMC.
Per-fan RPM in real time — or a clear "Fanless" on Macs that don't have any.
Live watts in real time. On Apple Silicon it reads per-domain SoC power — CPU, GPU, Neural Engine and RAM — and whole-machine draw from the battery. Root-free, no kernel extension.
On laptops, a read-only popover card: charge %, charging state, time remaining or time to full, plus long-term battery health % and cycle count. Hidden on desktop Macs.
LiveMetrics reads only the local interface statistics already on your machine, and sends nothing anywhere. There are no accounts, no analytics, and no tracking — just numbers, on your screen.
No analytics SDK, no ad IDs, nothing logged: it reads the network byte counters and Apple SMC sensor values macOS already maintains, and that data never leaves your Mac. That's effectively the whole privacy policy.
LiveMetrics is a free, native macOS menu-bar app that shows live network speed plus CPU, GPU, RAM and temperature every second — a lightweight, private system monitor that reads only local stats, and never a speed test. Version 1.6.0 is a free ~1.4 MB download for macOS 14 (Sonoma) and later, built by independent developer Mamunur Rashid with zero external dependencies.
LiveMetrics is a lightweight network speed monitor for Mac that lives in your menu bar and shows live upload and download speed, refreshed every second. Instead of running a one-off internet speed test, it works as a continuous bandwidth meter — a real-time network traffic monitor that reports the true throughput already moving through your connection.
Because it reads your Mac's own interface byte counters, LiveMetrics doubles as a Wi-Fi speed monitor and an Ethernet bandwidth monitor at the same time, automatically following whichever interface is active. It tracks today's peak upload and download throughput and draws a rolling network speed graph with an adjustable window — from 1 minute up to 30 — so you can read recent activity at a glance without opening a heavy system utility.
From the menu bar you get a live network meter and data throughput readout in the units you prefer — switch between bytes (KB/s, MB/s) and bits (Kb/s, Mb/s), and pick a one-line or two-line display. LiveMetrics is a private net speed monitor and bandwidth meter — an internet speed tracker that reads only local statistics, sends nothing anywhere, and sips CPU as a native Swift agent app with no Dock icon.
Beyond the network, LiveMetrics is also a full Mac system monitor: temperature and power draw ride in the menu bar by default, with CPU, GPU, RAM, disk and fans one tap away. Storage and, on laptops, battery show as read-only cards in the popover. It reads the kernel, IOKit, mach and the Apple SMC directly, so there are zero dependencies — no kernel extension, no admin rights, no helper.
That makes LiveMetrics a free, lightweight alternative to iStat Menus for the everyday essentials — see the full iStat Menus comparison for where each one fits.
macOS can show network activity through Activity Monitor's Network tab, but it lives in a separate window you have to open and watch. To see network speed in the menu bar at a glance, install LiveMetrics: it puts live upload and download throughput right next to the clock, updated every second, so you never have to open an app to check your connection.
When a page or download crawls, the first question is whether the network is the bottleneck or something else. A live bandwidth monitor answers that instantly: if LiveMetrics shows your download throughput pinned near its usual ceiling, the connection is working hard and the slowdown is elsewhere; if it's barely moving while you wait, the network is the suspect. Watching the rolling 5-minute graph also surfaces dropouts and dips that a one-off speed test would miss.
LiveMetrics is handy for remote work and video conferencing: keep an eye on real-time upload during calls, confirm a large download is actually moving, or watch throughput while streaming. Because it measures true traffic across Wi-Fi and Ethernet rather than running a test, the numbers reflect exactly what your apps are using right now.
Want the full walkthrough? Read the complete guide on how to show network speed in the Mac menu bar, see why LiveMetrics is a free iStat Menus alternative or how it stacks up in LiveMetrics vs Stats, or add a free live watts / power monitor to your menu bar.
Yes. LiveMetrics is a free macOS app, distributed as a direct .dmg download with no in-app purchases and no account required.
Yes. LiveMetrics is a native universal app that runs on both Apple Silicon (M-series) and Intel Macs running macOS 14 (Sonoma) or later.
No. A speed test generates traffic to a remote server to measure a maximum. LiveMetrics is passive — it reports the real throughput already flowing through your Mac, second by second, with nothing to run.
Because nothing is moving. LiveMetrics shows actual throughput, so the numbers rise during downloads, calls, streaming, or backups, and settle near zero when the network is quiet.
Yes. LiveMetrics reads from your active network interfaces, so it reports throughput across Wi-Fi, Ethernet, and other connections your Mac is using.
No. LiveMetrics is a lightweight agent app with no Dock icon and no extra windows. It only reads byte counters the system already maintains, so it sips CPU and resources.
Yes. Units auto-scale and you can switch between bytes (KB/s, MB/s) and bits (Kb/s, Mb/s). You can also choose a one-line or two-line menu bar display.
No. It reads only local interface stats on your Mac and sends nothing anywhere. There are no accounts and no tracking of any kind.
Yes. LiveMetrics can show CPU temperature, GPU temperature, CPU load (overall and per-core), GPU usage, memory and macOS memory pressure, disk activity, and fan speeds in RPM. Out of the box temperature and power draw are pinned to the menu bar alongside network speed, with CPU load, GPU usage, RAM, disk activity and fans one tap away and every chip customizable. The popover also adds read-only Storage and, on laptops, Battery cards. Temperatures are read directly from the Apple SMC in °C or °F, with no kernel extension and no admin password. Each enabled metric becomes a live card with a 5-minute sparkline, and you can pin up to six as compact colored chips in the menu bar.
Yes. LiveMetrics is a free macOS app that shows CPU load, GPU usage, RAM, disk activity, temperatures, fan speeds and live power draw in the menu bar — alongside live network speed. Temperature and power draw are pinned by default, with CPU, GPU, RAM, disk and fans one tap away — swap any in or turn any off. Storage and, on laptops, battery appear as read-only cards in the popover. It's a tiny 1.4 MB download, has no Dock icon, and reads all metrics locally from IOKit and the Apple SMC, with no kernel extension and no admin password.
For most people the core vitals are covered for free: LiveMetrics monitors network, CPU, GPU, RAM, disk, storage, temperatures, fans, power and battery while staying lightweight. iStat Menus is a paid app that goes deeper — longer history, notifications, per-process detail and more sensors. If you want the everyday essentials in your menu bar without paying, LiveMetrics covers them; if you need that extra depth, iStat Menus goes further.
Install LiveMetrics and it places live upload and download speed in your menu bar automatically. Turn on launch at login and it's there every time you start your Mac — no window to open, no setup.
Yes. As a live bandwidth monitor it shows whether traffic is actually moving. If throughput sits near zero while you wait, the network is the likely cause; if it's busy, the slowdown is elsewhere.
No. LiveMetrics is a direct download as a disk image (.dmg) — no App Store account needed. It only reads the local interface byte counters your Mac already maintains.
Put live upload and download speed in your menu bar, track today's peaks, and watch the last five minutes at a glance — a native app that keeps everything on your Mac.
Didn't start? Use the direct link.
Reads only local interface stats · Sends nothing anywhere · No tracking
Independent developer · Mac, web & developer tools
I build small, focused, privacy-respecting tools across macOS, the browser, and the code editor. LiveMetrics started as a single speed readout next to my clock — macOS had no built-in way to show it — and grew into a full system monitor only because I kept wanting more of my Mac's vitals there myself. I also made the Chrome extension TabAutopilot and the VS Code extension NPM Manager. Each one is built to do one thing well and stay out of your way.