The free iStat Menus alternative for Mac
iStat Menus is excellent — but it's paid. LiveMetrics now covers the core iStat metrics for free: network, CPU, GPU, RAM, disk, storage, temperatures, fans, power and battery, right in your menu bar. Here's an honest comparison of the real options.
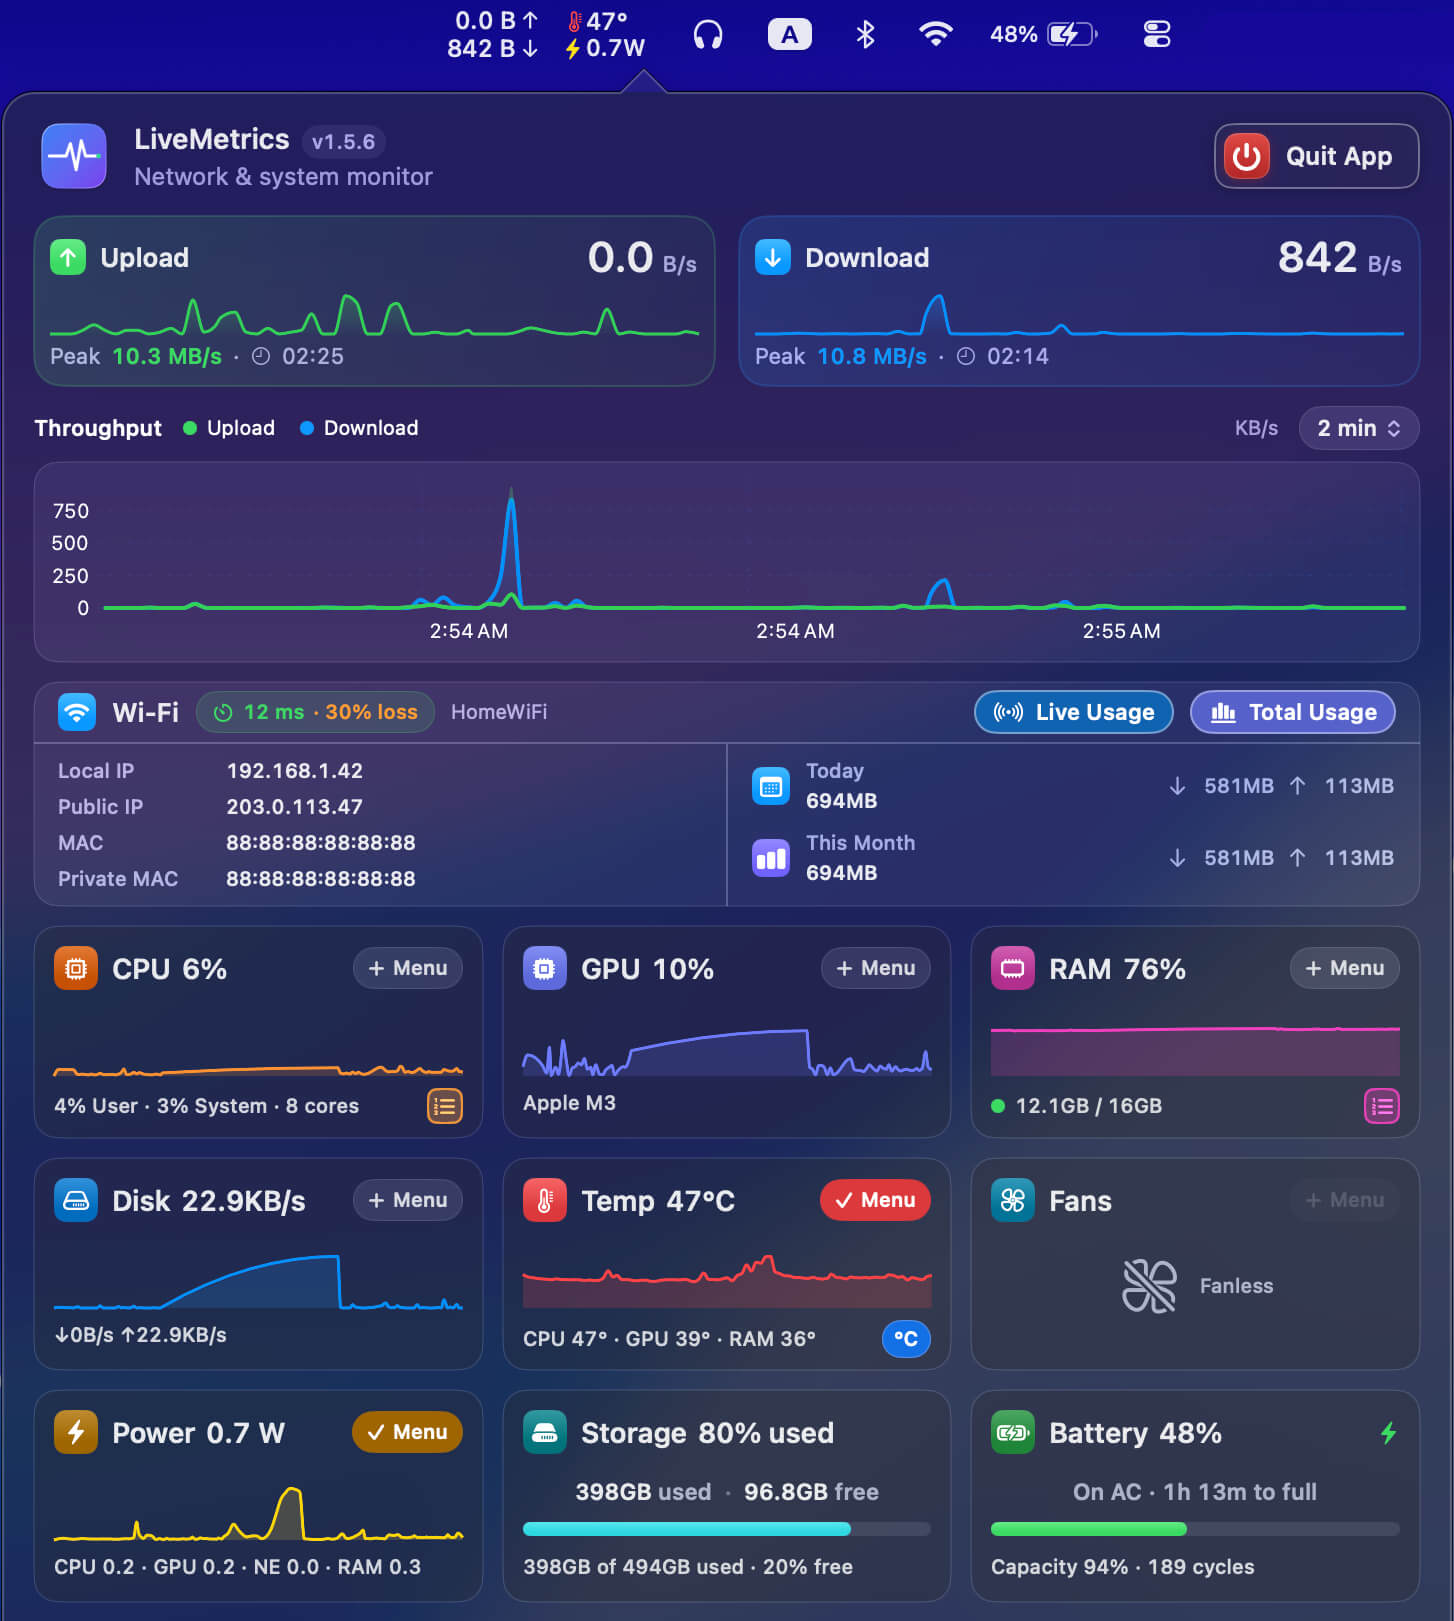
iStat Menus (by Bjango) packs CPU, GPU, memory, disk, sensors, battery and network into the menu bar. It's polished and worth its ~$11.99 one-time price. But many people searching for a free iStat Menus alternative want the same essentials without paying for a subscription suite. LiveMetrics now does exactly that: out of the box it's a full network + system monitor, pinning network speed plus temperature and power draw in the menu bar by default, with CPU, GPU, RAM, disk and fan speed a tap away — all free, all in the menu bar. iStat still goes deeper; LiveMetrics gives you the core metrics for nothing.
LiveMetrics vs iStat Menus vs Stats vs Activity Monitor
| LiveMetrics | iStat Menus | Stats (exelban) | Activity Monitor | |
|---|---|---|---|---|
| Price | Free | ~$11.99 one-time (trial; Setapp) | Free, open-source | Free (built in) |
| Network speed in menu bar | Yes | Yes | Yes | No (window / Dock graph only) |
| CPU / GPU / RAM | Yes | Yes | Yes | Yes (window only) |
| Disk throughput | Yes | Yes | Yes | Yes (window only) |
| Temperatures & fans | Yes (Apple SMC) | Yes | Yes | No |
| Power draw (watts) | Yes | Yes | Yes | No |
| Rolling graph (up to 30 min) | Yes | Yes | Yes | Limited |
| History, notifications, per-process | — | Yes (deeper) | Partial | Process list only |
| Footprint | ~1.4 MB, no Dock icon | Full suite | Full suite | System app |
| Privacy | Local only, sends nothing | Local | Local, open-source | Local |
| Best for | Free menu-bar essentials, tiny & private | The deepest all-in-one dashboard | Free open-source full monitor | No-install, occasional checks |
Details accurate as of June 2026; check each vendor for current pricing. iStat Menus is a trademark of Bjango; Stats is by Serhiy Mytrovtsiy (exelban).
What LiveMetrics now monitors (for free)
LiveMetrics is a full network + system monitor out of the box. Alongside live upload/download speed, it pins temperature and power draw in the menu bar by default — colored chips next to your speed numbers — with CPU, GPU, RAM, disk and fans a single tap away. You can pin up to six system chips: up to four lay out two per row, while five or six pack three per row so the menu-bar item grows wider, not taller. Each metric has a live card with a 5-minute sparkline, and every chip is customizable: turn any off, or swap one in, so the app stays as light as you want it.
- CPU — overall and per-core load, with the user/system split.
- GPU — utilization % on Intel, AMD and Apple Silicon, with the GPU name.
- RAM — used %, used/total, memory pressure (green/yellow/red), compressed and swap.
- Disk — live read/write throughput.
- Storage — disk space used and free, with a capacity bar. Read-only popover card (not a menu-bar chip).
- Temperatures — CPU, GPU and RAM sensors in °C/°F, read directly via the Apple SMC.
- Fans — per-fan RPM, or "Fanless" on fanless Macs.
- Power — live power draw in watts. On Apple Silicon it reads per-domain SoC power (CPU, GPU, Neural Engine, RAM), plus whole-machine draw from the battery when unplugged. Root-free, no kernel extension; degrades gracefully on Macs without the sensors.
- Battery — on laptops, charge %, charging state, time remaining or time to full, plus long-term battery health % and cycle count. Read-only popover card (not a menu-bar chip); hidden on desktop Macs.
It reads IOKit/mach, the IOReport energy model and the Apple SMC directly — zero dependencies, no kernel extension, no admin password — and sends nothing anywhere.
When iStat Menus is still worth paying for
LiveMetrics covers the core metrics, but iStat Menus goes deeper, and that's worth being honest about. iStat keeps longer history, supports notifications and threshold alerts, breaks usage down per process, reads more sensors, and offers combined graphs plus extras like a weather/calendar combo. If you want the deepest all-in-one dashboard and the analytics that come with it, iStat Menus is the category leader and its one-time price is fair. LiveMetrics is the free, lightweight essentials — not a full replacement for power users.
Stats (exelban): the free full-suite option
If you want a free, open-source full system monitor, Stats is the usual recommendation and a genuinely good one (MIT licensed, installable via brew install --cask stats). It overlaps a lot with LiveMetrics's free metrics; the difference is mostly taste. LiveMetrics is a single tiny app — a ~1.4 MB download — that's a full network + system monitor out of the box: network speed plus temperature and power draw in the menu bar by default, with CPU, GPU, RAM, disk and fans a tap away, and every chip customizable so you can pare it back as far as you like — handy if you'd rather not configure a whole suite.
When LiveMetrics is the right call
LiveMetrics is for people who want the core menu-bar essentials without paying. It's free with no in-app purchases, ships as a ~1.4 MB download, has no Dock icon, and ships as a direct .dmg that auto-updates. Out of the box it's a full network + system monitor — network speed (live up/down every second, today's peak up/down, and a rolling graph with an adjustable 1–30 minute window) plus temperature and power draw pinned in the menu bar by default, with CPU, GPU, RAM, disk and fans a tap away and every chip customizable. Everything stays local and private. If "I want network, CPU, RAM and temps in my menu bar, for free, and lightweight" describes you, this is the right call.
CPU temperature and fan speed in the menu bar — free
One of the most common reasons people look for an iStat Menus alternative is to watch CPU temperature without paying for a full suite. LiveMetrics reads temperature sensors directly from the Apple SMC (the System Management Controller built into every Mac) with no kernel extension and no admin password. Enable the Temp card and you get CPU, GPU and RAM sensor readings in °C or °F, updated live. Fan speed sits right alongside — per-fan RPM, or "Fanless" on the MacBook Air and other passively cooled Macs.
That covers the everyday reason people check temps: confirming a heavy workload — a video export, a long compile, a game — isn't pushing the hardware too hard. For threshold alerts and long-term temperature history, iStat Menus goes further; for a live glance in the menu bar, LiveMetrics's temperature card is the free option.
How to switch to LiveMetrics (1 minute)
- Download the free .dmg and drag LiveMetrics to Applications.
- Open LiveMetrics — it's notarized by Apple, so it opens with a normal double-click (click Open if macOS asks to confirm the download). First-launch notes.
- Network speed plus temperature and power draw appear in your menu bar right away. Open the popover to customize the chips — turn any default off, or swap in CPU, GPU, RAM, disk or fans. Turn on Launch at Login to keep it there.
New to this and want the full step-by-step? See how to show network speed in the Mac menu bar, the LiveMetrics vs Stats comparison, or the free live watts / power monitor guide.
Get LiveMetrics — Free macOS 14 Sonoma or later · Apple Silicon & Intel · no account, no tracking
FAQ
Is there a free iStat Menus alternative?
Yes. LiveMetrics is a free menu-bar monitor that now covers the core iStat Menus metrics — network speed, CPU, GPU, RAM, disk, storage, temperatures, fans, power draw and battery — in a ~1.4 MB download, with no account and no tracking. Stats by exelban is another free, open-source full monitor. macOS Activity Monitor is free too, but it lives in a window with no menu-bar readout.
How much does iStat Menus cost?
iStat Menus is a paid app from Bjango, around $11.99 as a one-time purchase (with a free trial), and it's also available through the Setapp subscription. It's a deeper system monitor with longer history, notifications, per-process breakdowns, more sensors and combined graphs. LiveMetrics covers the same core metrics for free, but iStat Menus goes further.
Can LiveMetrics show CPU, GPU, RAM and temperatures like iStat Menus?
Yes — out of the box. LiveMetrics is a full network + system monitor by default: alongside network speed it pins temperature and power draw in the menu bar the moment you open it, and CPU load, GPU usage, RAM, disk read/write throughput and fan speeds are one tap away. CPU load is overall and per-core; temperatures cover CPU, GPU and RAM sensors via the Apple SMC. Every metric is customizable — turn any default off, or swap in CPU, GPU, RAM, disk or fans. Each has a live card with a 5-minute sparkline, and you can pin up to six as colored chips in the menu bar. The popover also adds read-only Storage and, on laptops, Battery (charge, health % and cycle count) cards.
Is LiveMetrics open source?
LiveMetrics is free but not open source; it's distributed as a direct .dmg download. If you specifically want an open-source full system monitor, Stats by exelban (MIT licensed) is the usual recommendation.
Is there a free alternative to Stats (exelban) for Mac?
LiveMetrics overlaps with Stats: both are free and cover network, CPU, GPU, RAM, disk, storage, temperatures, fans, power and battery with no App Store account. Stats is open-source (MIT) and installable via Homebrew. LiveMetrics is a smaller single app (~1.4 MB download) that's a full network + system monitor out of the box — network speed plus temperature and power draw in the menu bar by default, with CPU, GPU, RAM, disk and fans a tap away. Every chip is customizable, so you can pare it back as far as you like. Want open source? Choose Stats. Want something tiny that's a full monitor the moment you open it, yet trims down on demand? LiveMetrics.
Does LiveMetrics work on macOS Sequoia?
Yes. LiveMetrics requires macOS 14 Sonoma or later and runs on macOS 15 Sequoia with no changes. It is notarized by Apple, so it opens with a normal double-click — no Privacy & Security approval needed.